Wealth Starter
Advisors
Mathematically driven investment decisions
Recognize trends before they begin
End of year PROMOTION! New members join for only $10 per month!
Take advantage now, cancel at any time.
Let's talk about what we offer.
Investment Insights
Institutional-level investment tracking, but for all types of investors…experienced, or beginner.

Predictive Algorithm
Access to our data-driven model that helps determine potential future performance.

Data-driven analytics covering over 500:
individual stocks
country ETFs
commodities
bonds
cryptocurrencies
and more!
Additional features that boost your investment awareness:
Investment Search
Check out
investments that
you care about.
Current Trends
Explore the
latest snapshot of
where trends are.
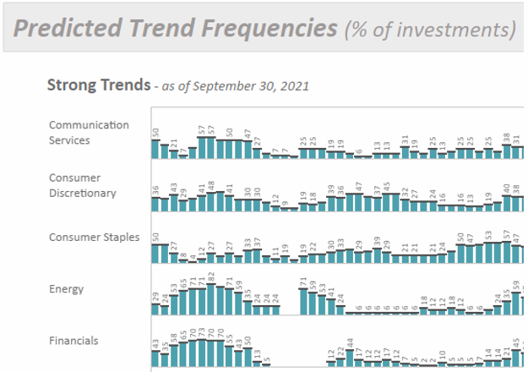
Trend Frequencies
Discover which
asset classes are
currently trending.
Historical Heat Maps
Visualize
macro and sector
trend history.
Our fundamental principles.
Applied Mathematics
An algorithmic and mathematical process can be
established to predict price movement direction of
stocks, exchange-traded funds, and mutual funds.
Research Expectation vs. Reality
Strong fundamental research can produce “correct” results, but investments can still experience unfavorable price movements. Focus rather on price movement analysis.
Emotions Do Not Dictate Process
Invest capital without opinion, feelings, or pre-determined assumptions. Instead, allow mathematics to build a
portfolio of high risk-adjusted return capabilities.
Market Participants Drive Process
The broad market defines early-stage underlying price
movements. This algorithmic investment process
measures and captures these movements.
See the algorithm in action!
Join today for access to over 500 different investments
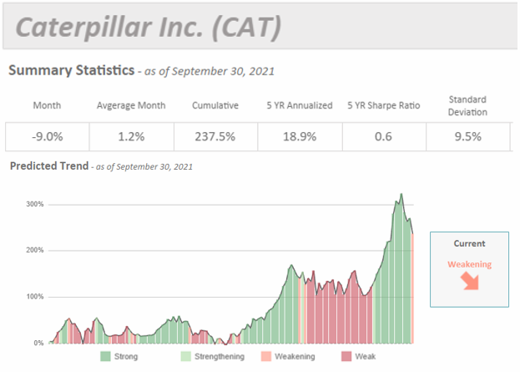
How to interpret the algorithm graph:
Strong or Strengthening
When the underlying investment trend begins to ‘strengthen‘, the algorithm predicts that the future performance will likely be positive. This continues monthly until the investment begins to ‘weaken‘ (orange, red).
Weak or Weakening
As the underlying rate of change trend breaks down, the algorithm predicts that the future performance will likely be negative. This continues monthly until the investment begins to strengthen (green).
Explore investments across entire sectors!
How to interpret the heat map above:
Sectors Trending Upwards
When sectors are trending upwards, our predictive algorithm determines that these have more ‘strengthening‘ investments. Overall, these sectors likely will perform well until they begin to begin curving downwards.
Sectors Trending Downwards
Sectors that are turning, or trending, downwards have more ‘weakening‘ investments as determined by our algorithm. These sectors are not expected to perform well in the future until their direction changes.
Start making better investment decisions!
Important disclosures:
Wealth Starter Advisors LLC does not render personalized investment advice. The content and services found here are provided to you for informational purposes only and should not be construed as an offer to buy or sell a particular security, or investment. Further, content is not a solicitation of offers to buy or sell a particular security, or investment.
All users should consult a financial advisor, tax, or legal professional before making investment decisions. Past performance is not a guarantee of future results. Investing involves risks, including loss of principal.
